Blog > Post
RDBMS dominate the database market, but NoSQL systems are catching up
by Paul Andlinger, 21 November 2013
Tags:
Since we have already more than 200 different database systems in our ranking, we wanted to see some statistics and add some numbers to the ongoing discussions regarding the current status quo and future trends in the database market.
The most important aspect of each database system definitely is the way it represents the stored data, the so-called database model. Therefore the database model is the criteria we have ever been using for classifying all the individual systems into categories (like relational systems, key-value stores etc.).

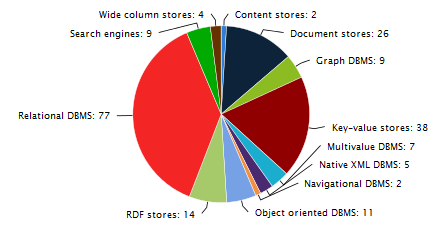
The above pie chart simply counts the number of different systems per category. It’s not surprising that relational systems account for more than a third (77 systems) of all systems (currently 204 systems). However, there are a couple of categories, which also have a significant number of representatives, notably key-value stores (with currently 38 systems, half the number of relational systems) and document stores (26 systems). Apart from some rather ‘exotic’ categories we see a solid established group of categories (like RDF stores, search engines, object oriented DBMS, graph DBMS, native XML DBMS, multivalue DBMS and wide column stores), which are typically used for special purpose requirements (semantic networks, information retrieval etc.).

For this pie chart we use the same categories, but instead of counting the number of representatives we use their popularity. More precisely, we sum up the ranking score of all systems per category and show that as a percentage of the ranking score total of all systems. This chart is dominated by the relational systems, with more than 90% popularity. Contrasting this result to the number of systems in the relational category (as mentioned above, about a third of all systems are relational systems), gives evidence to the fact that the relational model currently has an undisputable importance and status in the database market. This dominance is highly owed to the strength of the big three database management systems (Oracle, MySQL, Microsoft SQL Server), with each of those having a higher popularity than all other systems together. The other side of the coin is that we see a highly segregated market of non-relational systems, a fact which is not unusual for rather new technologies, and we can expect some future consolidation there.
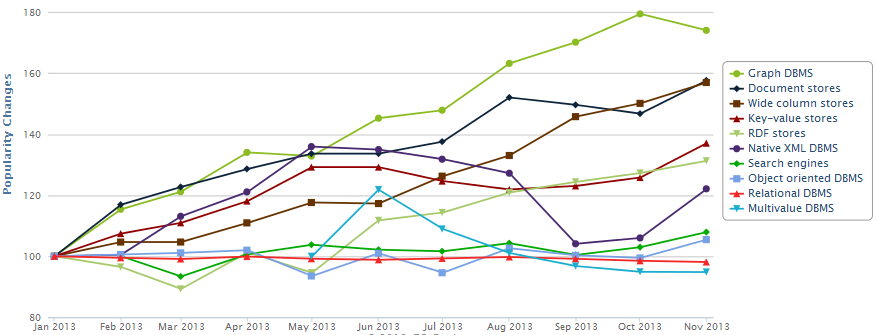
The above chart gives some interesting insights in the evolution of categories’ popularity over the last year. In order to avoid statistical distortion (many different systems, but all of them with rather low popularity), we select the best three systems per category and month. To discover otherwise hidden trends we normalize the starting point for each category to 100 points and show the evolution of the following months. This chart draws a very different picture of the database market: whereas relational systems loose slightly over time (from 100 points to 98 points – on an extremely high level, admittedly), we see other categories growing heavily: graph DBMS, document stores, wide column stores, each gaining more than 50 points during the last year and being backed by well established systems like Neo4J, MongoDB and Cassandra (just to name the current category-leaders).
When we denote graph DBMS, document stores, wide-column stores, key-value stores (and others) as NoSQL systems, our figures indicate a clear trend towards those systems. That said, we must not forget that due to the current popularity of relational systems, NoSQL systems still have to climb a very high, steep (and probably dangerous) mountain.
Please find the report here.
Share this page

 RSS Feed


