

 RSS Feed
Blog > Post
Applying Graph Analytics to Game of Thrones
von Amy Hodler & Mark Needham, Neo4j (guest author), 12. Juni 2019
Tags:
Neo4j provides native graph storage, compute, and analytics in a unified platform. Our goal is to help organizations reveal how people, processes, locations and systems are interrelated using a connections-first approach. The Neo4j Graph Platform powers applications tackling artificial intelligence, fraud detection, real-time recommendations and master data.
Merging Transactions and Analytics Processing
The lines between transaction and analytics processing have been blurring for some time. Online transaction processing (or OLTP) operations are typically short activities like booking a ticket or crediting an account. It implies a lot of low-latency query processing and high data integrity. This has been approached very different from online analytical processing (OLAP) which facilitates more complex queries and analysis over historical data with multiple data sources, formats, and types.
Modern data-intensive applications now combine real-time transactional operations with analytics. This merging of processing has been driven by advances in software as well as lower-cost, large-memory hardware. Bringing together analytics and transactions enables continual analysis as a natural part of regular operations.
We can now simplify our architecture by using a single, unified platform for both types of processing. This means our analytical queries can take advantage of real-time data and we can streamline the iterative process of analysis in what has been described as a hybrid transactional and analytical processing (HTAP).
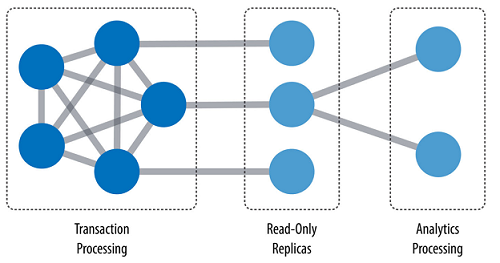
A hybrid platform supports the low latency query processing and high data integrity required for transactions while integrating complex analytics over large amounts of data.
Graph Analytics & Algorithms
As data becomes increasingly interconnected and systems increasingly sophisticated, it’s essential to make use of the rich and evolving relationships within our data. If you’re already using a Graph database, this is a great time to add in graph analytics to your practices to reveal structural and predictive patterns in your data.
At this highest level, graph analytics are applied to understand or forecast behavior in dynamic groups. This requires understanding a group’s connections and topologies. Graph algorithms accomplish this by examining the overall nature of networks through their connections using mathematics specifically developed for using connections. With this approach, we can understand the structure of connected systems and model their processes.
Using graphs we can model dynamic environments from financial markets to IT services, find more predictive elements for machine learning to combat financial crimes, or uncovering communities for personalized experiences and recommendations. Graph analytics help us infer relationships and predict behavior.
Categories of Graph Algorithms
Graph algorithms provide one of the most potent approaches to analyzing connected data because their mathematical calculations are specifically built to operate on relationships. There are many types of graph algorithms and categories. The three classic categories consider the overall nature of the graph: pathfinding, centrality, and community detection. However, other graph algorithms such as similarity and link prediction algorithms consider and compare specific nodes.
- Pathfinding (and search) algorithms are fundamental to graph analytics and algorithms and explore routes between nodes. These algorithms are used to identify optimal routes for uses such as logistics planning, least cost routing, and gaming simulation.
- Centrality algorithms help us understand the roles and impact of individual nodes in a graph. They’re useful because they identify the most important nodes and help us understand group dynamics such as credibility, accessibility, the speed at which things spread, and bridges between groups.
- Community algorithms evaluate related sets of notes, finding communities where members have more relationships within the group. Identifying these related sets reveals clusters of nodes, isolated groups, and network structure. This helps infer similar behavior or preferences of peer groups, estimate resiliency, find nested relationships, and prepare data for other analyses.
- Similarity algorithms look at how alike individual nodes are. By comparing the properties and attributes of nodes, we can identify the most similar entity and score differences. This helps build more personalized recommendations as well as develop ontologies and hierarchies.
- Link Prediction algorithms consider the proximity of nodes as well as structural elements, such as potential triangles between nodes, to estimate the likelihood of a new relationship forming or that undocumented connections exist. This class of algorithms has many applications from drug repurposing to criminal investigations.
Applying Graph Analytics to Game of Thrones
Now let’s dive into applying graph algorithms on a dataset of everyone's favorite fantasy show, Game of Thrones.
NEuler - The Graph Algorithms Playground
We'll use the NEuler Graph Algorithms Playground Graph App to do this. NEuler provides an intuitive UI that lets users execute various graph algorithms without typing any code. It’s a Neo4j labs project to help people quickly get familiar with graph algorithms and explore interesting data. More information about the app, including installation instructions, is available in the release blog post .
Once NEuler is installed we’ll need to load the Game of Thrones Sample Graph, as shown in the printscreen below:
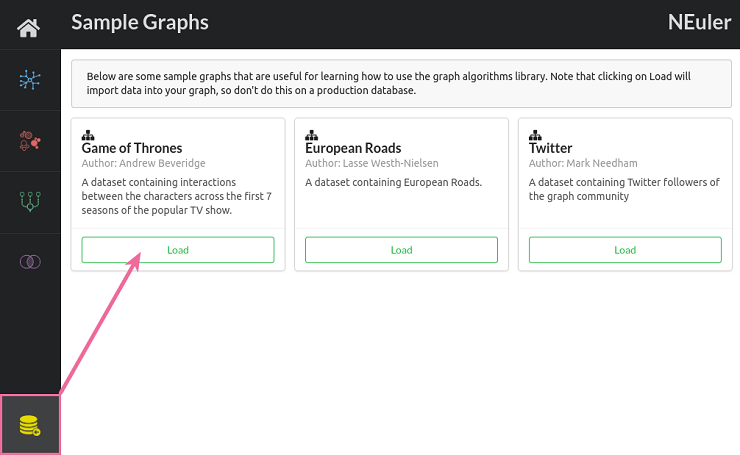
This dataset is based on Andrew Beveridge's Network of Thrones, and contains characters and their interactions across the different seasons.
Analyzing Game of Thrones
With the dataset loaded we're ready to start analyzing it. Our focus will be on season 2 of the TV show, but we will occasionally show the results from other seasons for comparison.
We'll use community detection algorithms to find clusters of users in Westeros and Centrality algorithms to find the most important and influential characters.
The Louvain Modularity algorithm detects communities in networks, based on a heuristic maximizing modularity scores. (Modularity scores range from -1 and 1 as a measure of relationship density inside communities to relationship density of outside communities.) If we run it for season 2 of the Game of Thrones dataset and visualize output format, we'll see the following graph:
In the upper left purple cluster, we can see the Daenerys group is off on their own, disconnected from everybody else. The people in that cluster didn't interact with anybody else. We initially thought there must be a problem with the data or algorithm, and ran another community detection algorithm, Connected Components, to confirm our findings.
The Connected Components algorithm is a community detection algorithm that detects clusters of users based on whether there's any path between them. If we run that algorithm, we'll see the following visualization:
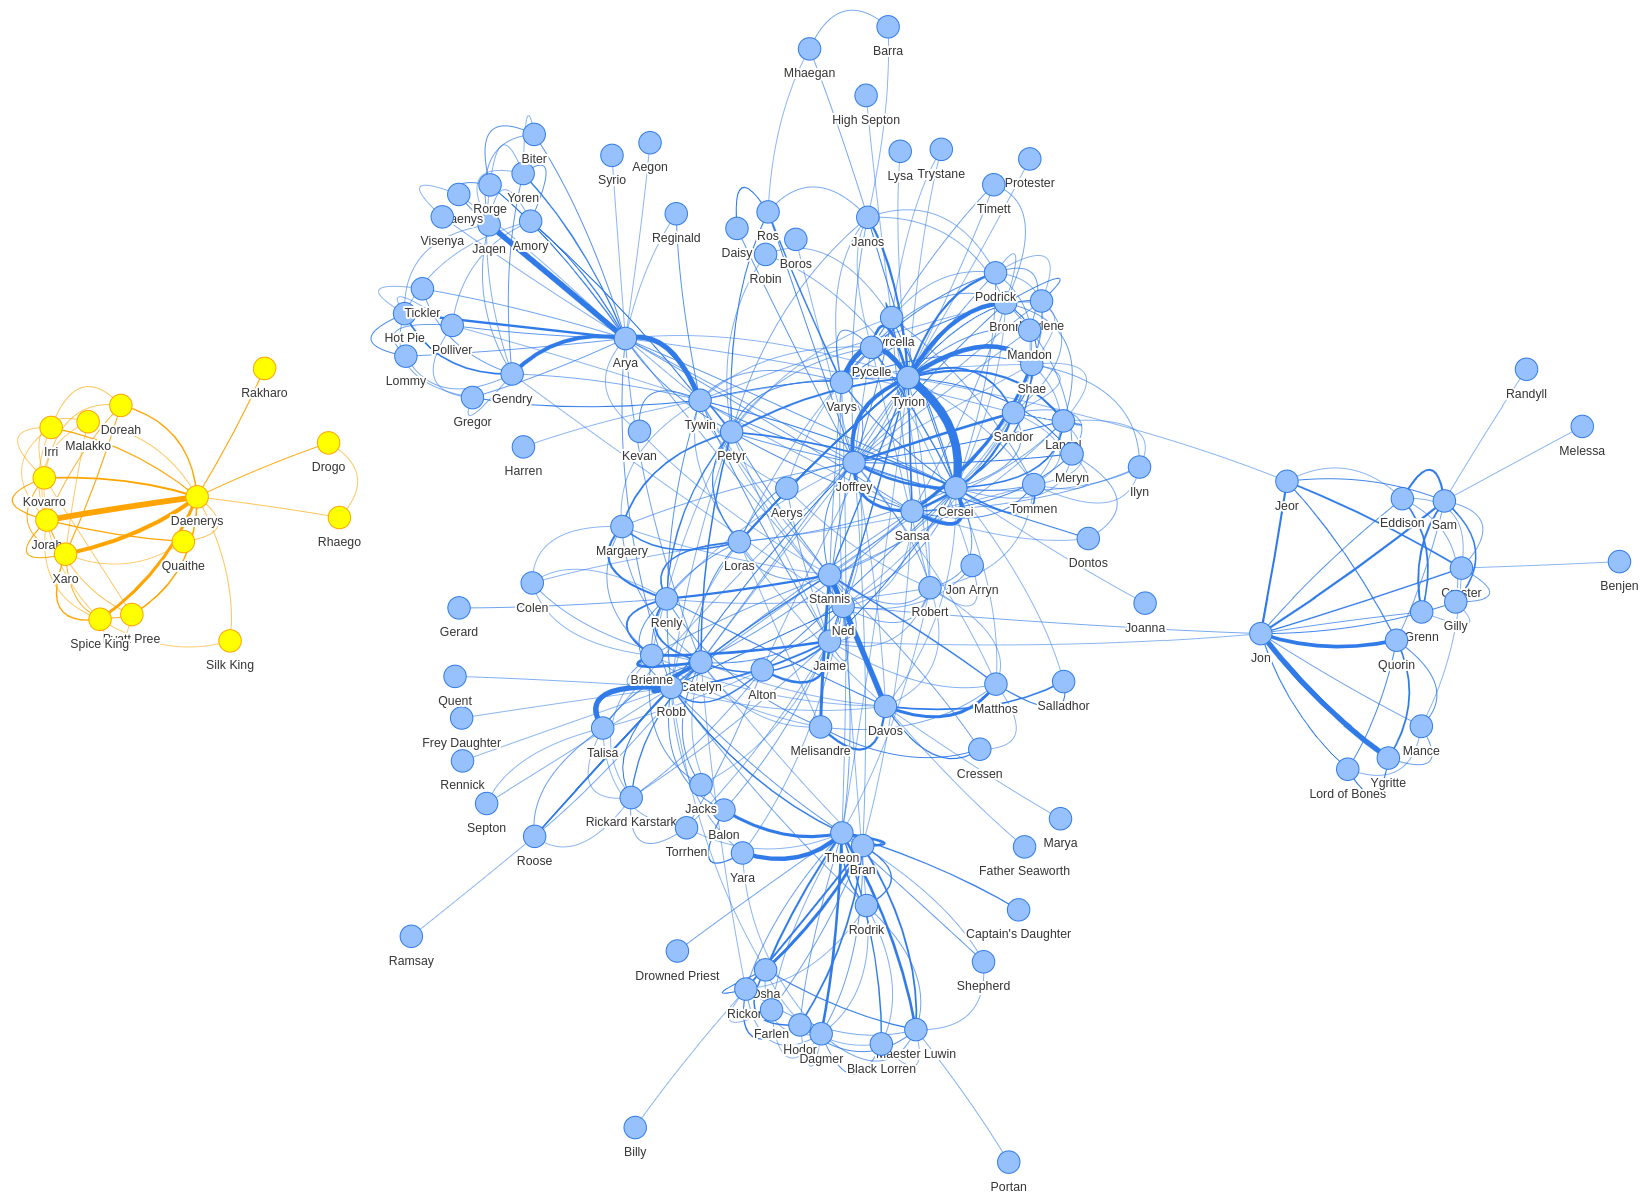
Here, we have just two communities: the one with Daenerys on the left, and the vast majority of other characters on the right. This confirms our findings from the Louvain Modularity algorithm, and if we stretch our memory back to season 2, we'll remember that Daenerys was off on an island away from the rest of the main characters.
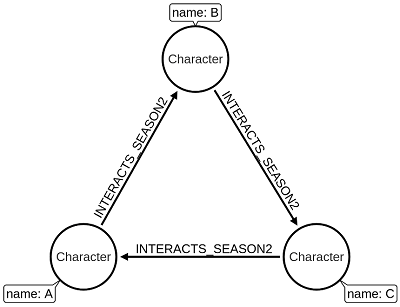
Another way of analyzing community structure is to compute the number of triangles that a user is a part of. A triangle in this graph means that Character A interacts with Character B, Character B interacts with Character C, and Character C interacts with Character A. We can see an example of a triangle in the diagram below:
If we run the Triangle Count algorithm and select the table output format, we'll see the following output:
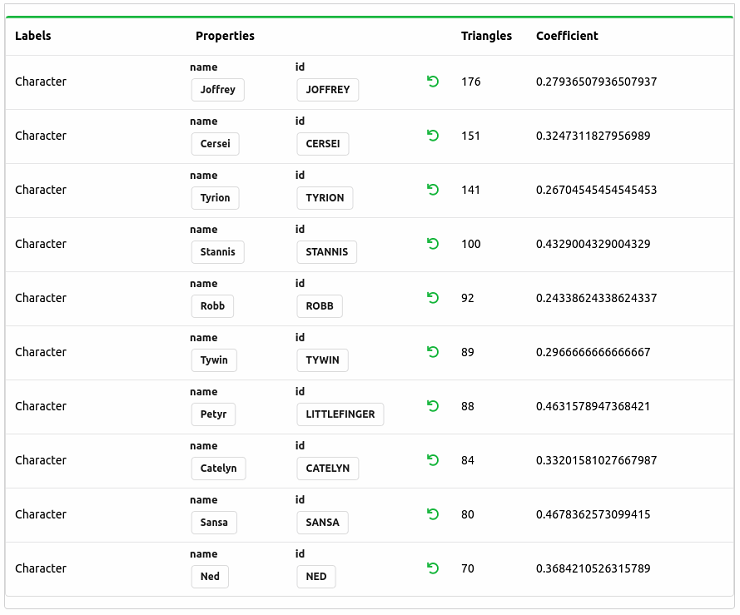
We'll also notice that this algorithm returns a coefficient score. This Clustering Coefficient measures how well our neighbors are connected compared to the maximum they could be connected. A score of 1 would indicate that all our neighbors interact with each other. So while Joffrey scores very well on overall triangles (raw number of neighbors interacting), we notice that the neighbors of Littlefinger and Sansa have a higher probability (cluster coefficient) of being connected.
Next, we’ll use centrality algorithms to find important characters.
Centrality Algorithms
The simplest of the centrality algorithms is Degree Centrality, which measures the number of relationships connected to a node. We can use this algorithm to find the characters that have the most interactions.
When we run the algorithm we'll see the following output:
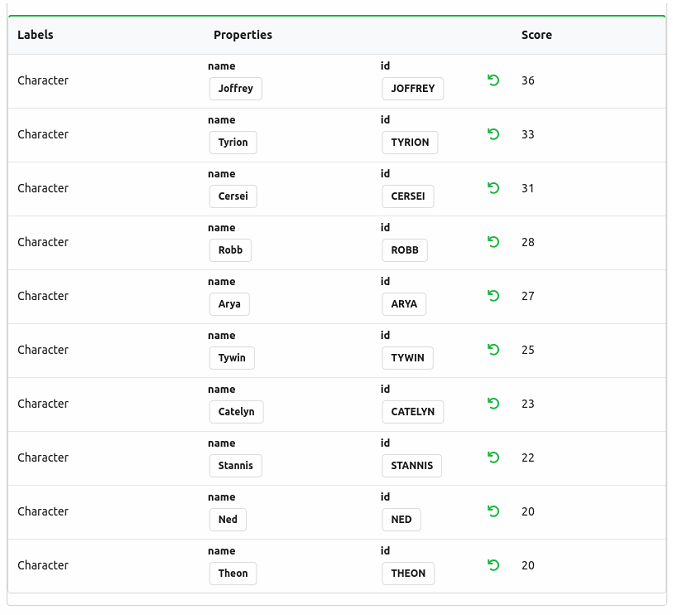
Joffrey and Tyrion are interacting with the largest number of people, which tells us that season 2 of the show is mainly based on these characters. It doesn't necessarily mean that these are the most influential characters, but they're certainly the ones who are talking a lot!
The Betweenness Centrality algorithm detects the amount of influence a node has over the flow of information in a graph. It’s often used to find nodes that serve as a bridge from one part of a graph to another.
We can use this algorithm to find people who are well connected to sub-communities within Westeros. If we run the algorithm and select the chart output type, we'll see the following output:
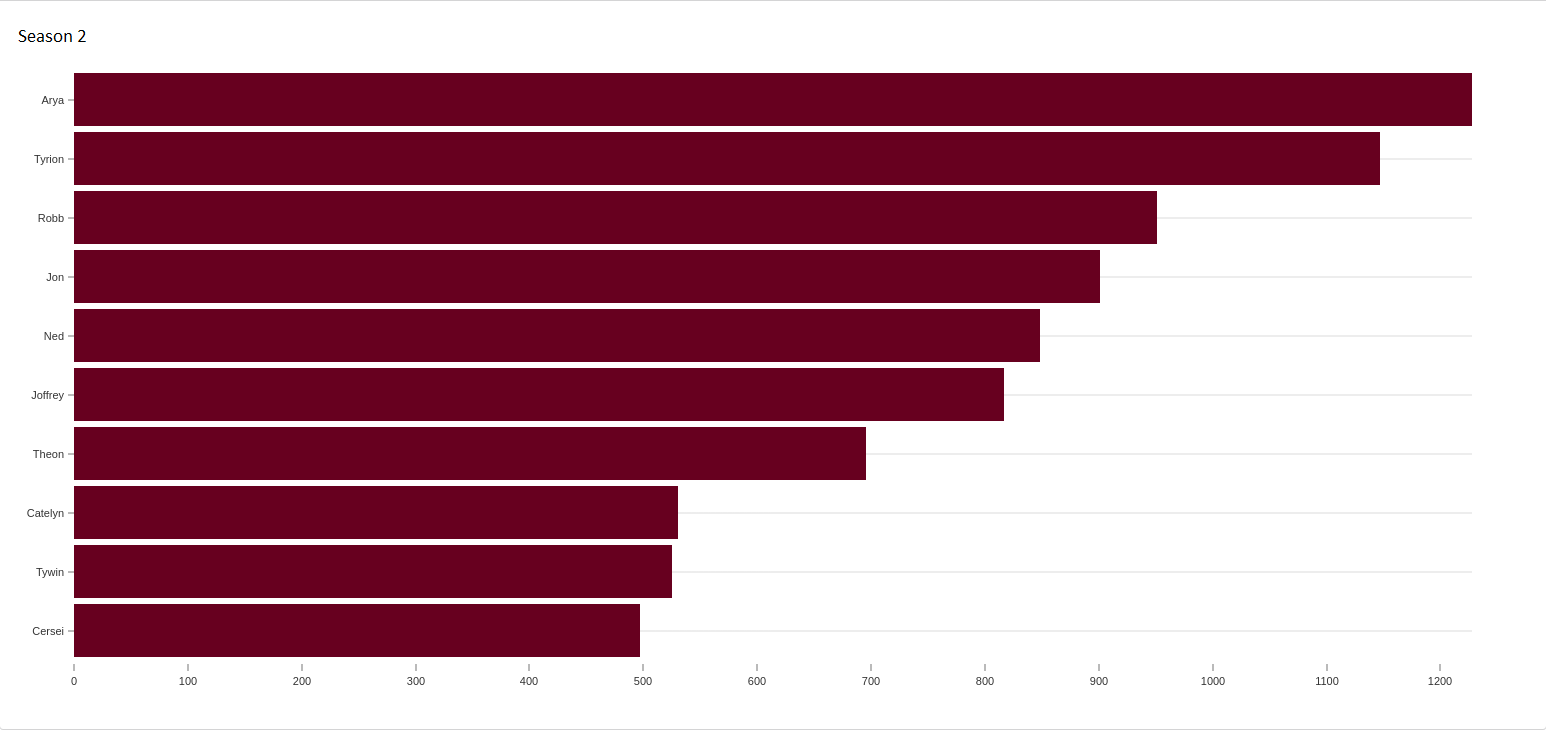
The chart option will be displayed when applicable and is a nice way to look at many of the centrality algorithms where ranking is more significant than actual scores. We see here that Joffrey has fallen down from rank 1 for degree centrality to only rank 6 here, and Arya has moved up from rank 5 for degree centrality to rank 1 here. In season 2 Arya is on the road, and would act as a bridge node between the people she interacts with and those in the other parts of the kingdom.
We can also take a peek forward to season 7 and see how things have changed:
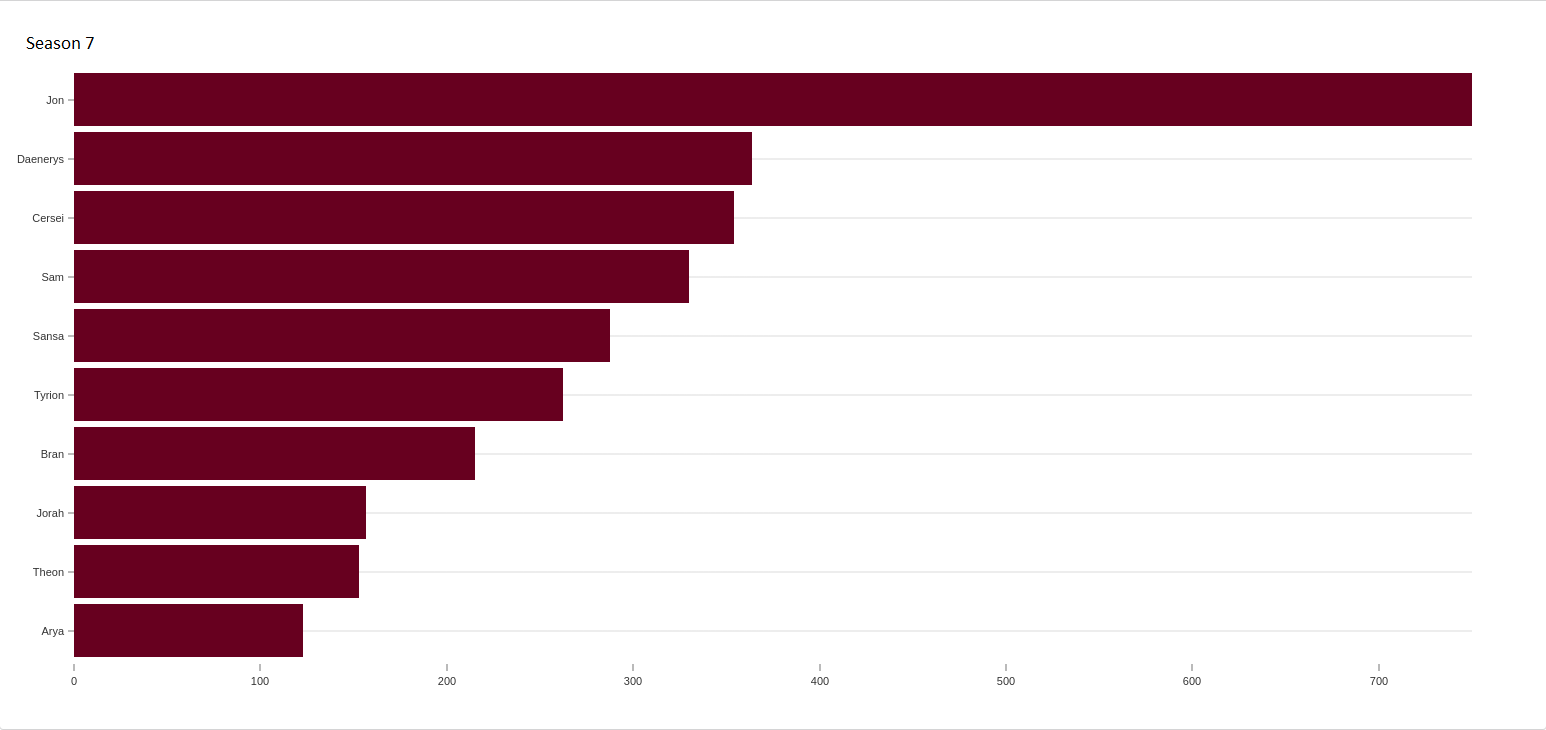
Jon is now overwhelmingly the top-ranked character based on betweenness centrality. His score is twice as high as the next person. He's likely acting as the glue between groups of people who don't interact with people outside their core group, except with Jon.
Another measure of importance is PageRank, which measures overall, including indirect, influence. It will find not only people who are significant in their own right but also those who are interacting with more influential people.
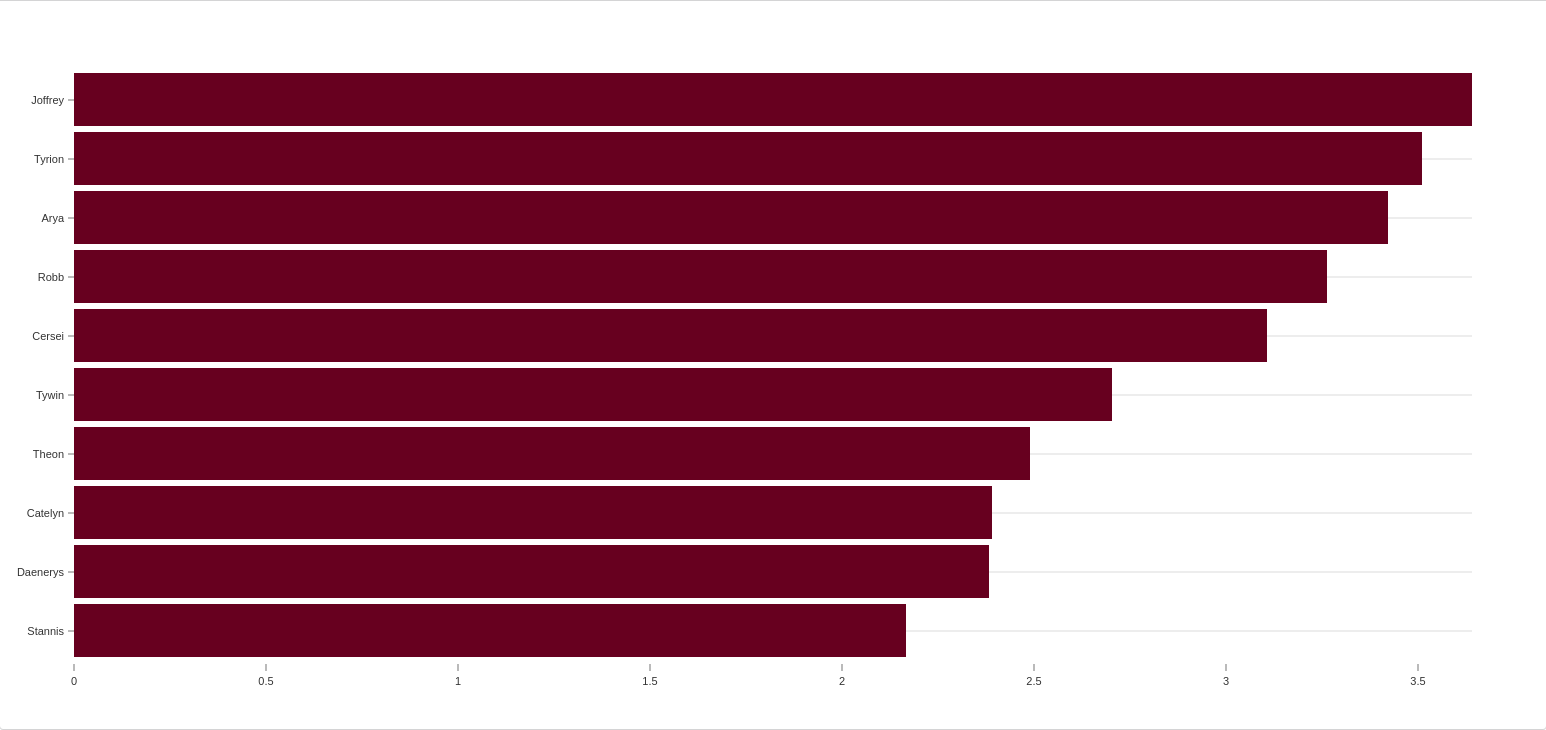
For the above PageRank results we see some familiar faces - Joffrey and Tyrion also ranked highly for Degree Centrality and Arya was top-ranked for Betweenness Centrality. Note that for other datasets, especially those with complex relationships, we would likely see more variation in centrality rankings.
Now let’s take a journey back in time and compare running PageRank on season 1, which gives the following output:
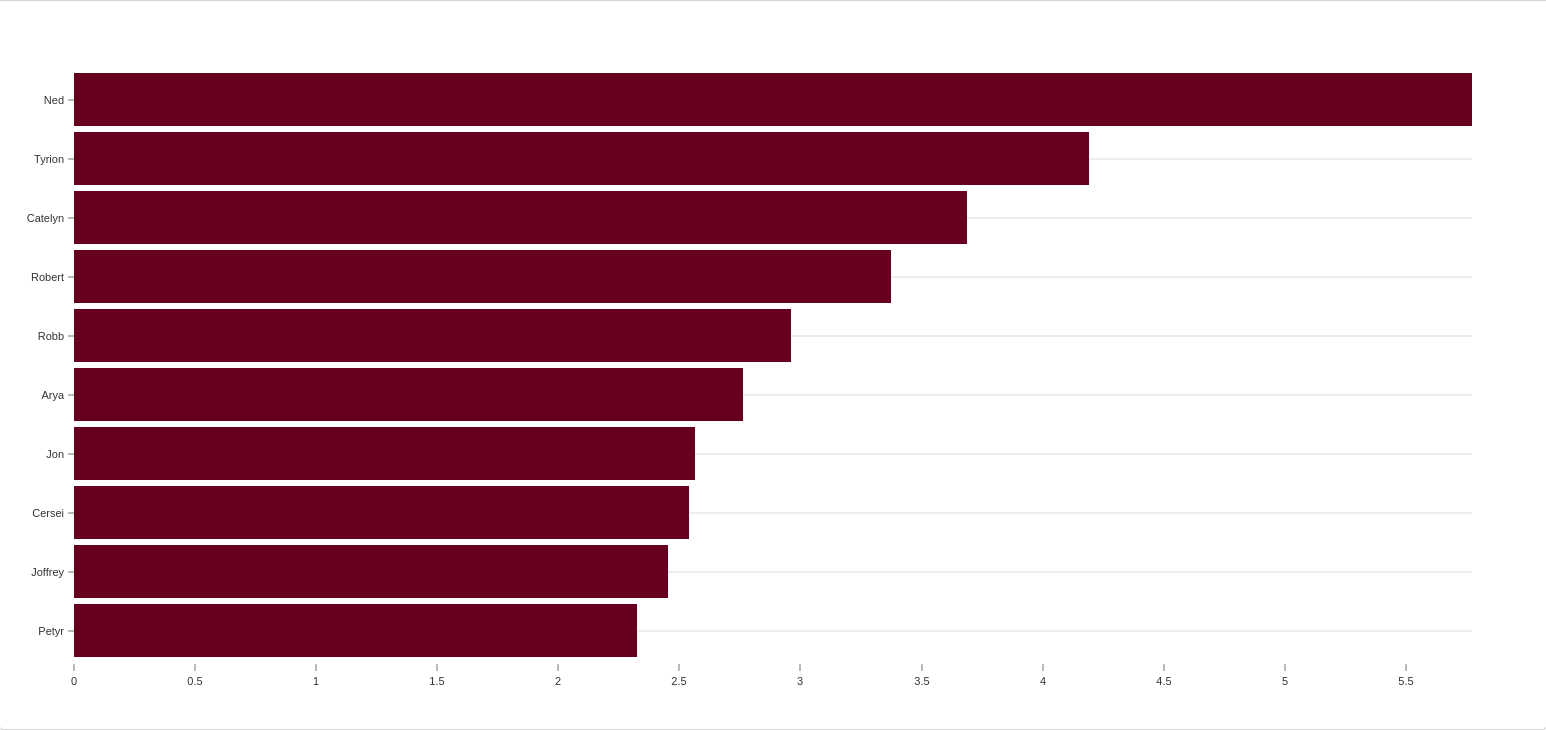
Ned was clearly the most influential character at this stage, but sadly it didn't last! By comparing results over segmented data (perhaps by time, geography, or demographic) we can reveal a deeper story.
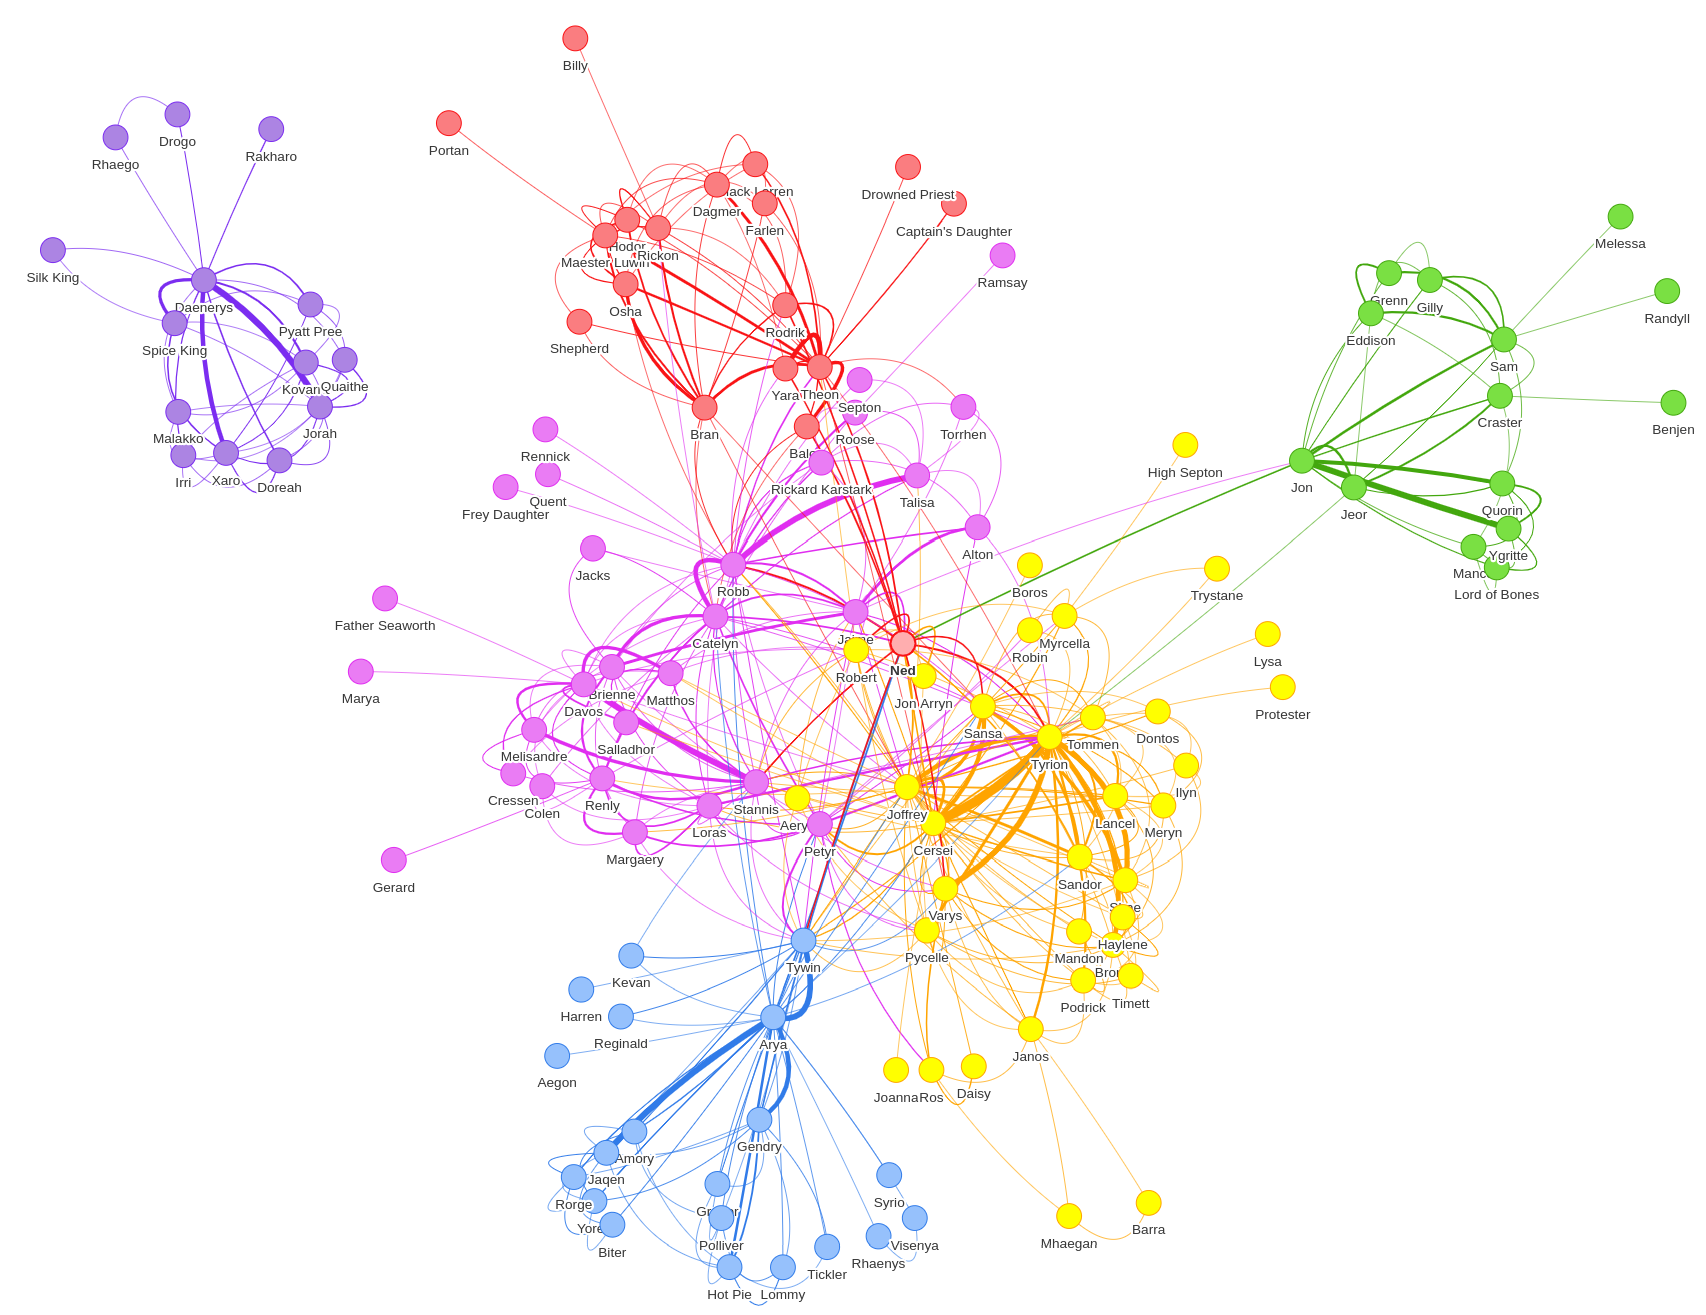
Finally, let’s conclude this post by showing how to combine the results of community detection and centrality algorithms in the visualization output format.
The following diagram colors nodes based on their Louvain Modularity cluster and sizes them based on their PageRank score:
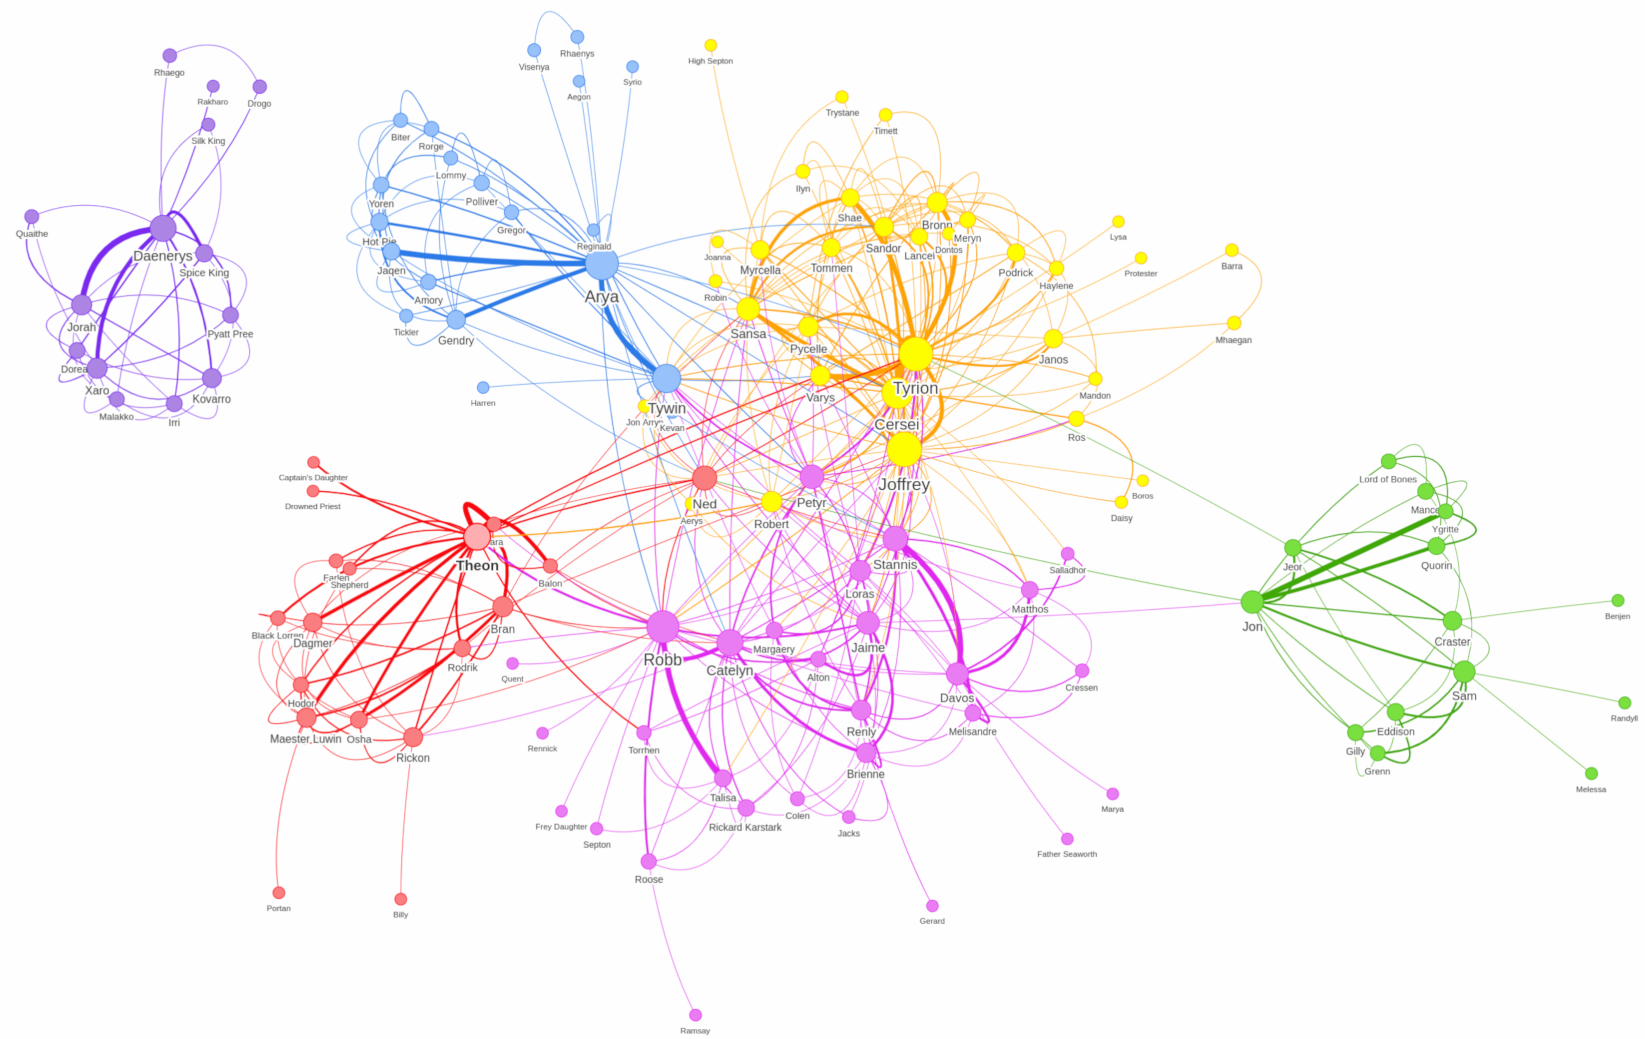
Now we can not only see the clusters, but also the most important characters in a particular cluster. Unsurprisingly we learn that Daenerys is the most important character in the isolated cluster. We'll also see some other familiar faces including Arya and Tywin in the blue cluster, Tyrion, Cersei, and Joffrey in the yellow one, and Jon in the green one.
We hope you've had as much fun reading this analysis as we've had writing it. It’s fascinating that you can learn so much about Game of Thrones by looking only at its metadata.
If you’d like to learn more about graph analytics and their application, you can find practical examples and working code for Spark and Neo4j in the free digital copy of the O’Reilly Graph Algorithms book.
About the Authors: |
Mark Needham is a graph advocate and developer relations engineer at Neo4j. He works to help users embrace graphs and Neo4j, building sophisticated solutions to challenging data problems. Mark has deep expertise in graph data, having previously helped to build Neo4j’s Causal Clustering system. He writes about his experiences of being a graphista on his popular blog at markhneedham.com/blog and tweets @markhneedham. |
 |
Amy E. Hodler is a network science devotee and AI and graph analytics program manager at Neo4j. She promotes the use of graph analytics to reveal structures within real-world networks and predict dynamic behavior. Amy helps teams apply novel approaches to generate new opportunities at companies such as EDS, Microsoft, Hewlett-Packard (HP), Hitachi IoT, and Cray Inc. Amy has a love for science and art with a fascination for complexity studies and graph theory. She tweets @amyhodler. |
Teilen sie diese Seite mit ihrem Netzwerk

